

Machine learning (ML) holds transformative potential for business operations. However, before delving into intricate algorithms and data analysis, it’s vital to pause and pinpoint the core business problems ML can address. This section delves into the criticality of problem identification and highlights how machine learning metrics serve as guiding beacons in the realm of ML projects. Success metrics act as navigational compasses, aiding in steering projects toward desired outcomes. By leveraging these metrics, businesses can effectively evaluate and optimize ML models, ensuring alignment with organizational objectives. Thus, understanding the significance of identifying the right problems and utilizing machine learning metrics facilitates the successful integration of ML technology into business strategies, driving innovation and efficiency.
Why Identifying Machine Learning Business Problems Matters
Imagine building a beautiful race car, but instead of taking it to the track, you use it to haul groceries. While the car itself is impressive, it’s not fulfilling its true potential. The same goes for machine learning.
Here’s why identifying the right business problems is crucial:
- Focuses Resources: Machine learning projects require time, expertise, and data. By clearly defining the problem you want to solve, you ensure your resources are directed toward achieving a specific business goal.
- Improves Success Rates: Throwing algorithms at random problems rarely yields optimal results. Understanding the problem allows you to choose the most appropriate ML technique, increasing the chances of a successful project.
- Demonstrates Value: When you can clearly articulate the business problem you’re solving and the expected benefits, it strengthens your case for project approval and investment.
Success Metrics: Your Roadmap to Machine Learning Success
So, how do you identify the right problems for machine learning? Success metrics are your guiding light. These are quantifiable measures that define what “success” looks like for your project.
Here’s how success metrics help navigate machine learning endeavors:
- Align with Business Goals: Success metrics should directly connect to your overall business objectives. For example, if you’re aiming to improve customer retention, a success metric could be a decrease in churn rate.
- Track Progress: Metrics allow you to monitor your project’s performance and identify areas for improvement. Did your model lead to a 10% increase in sales, as projected? Metrics provide the answer.
- Compare Solutions: Metrics allow you to compare different machine learning models or approaches and determine which one delivers the best results for your specific business problem.
By identifying the right business problems and aligning them with clear success metrics, you set your machine learning project up for a smooth ride toward achieving real-world business impact.
Understanding The Business Problem Machine Learning Metrics
This is the foundation of any successful project. It involves getting a clear picture of the current situation and the issues the business is facing. Here’s how to approach it:
- Analyze Data and Reports: Look at existing sales figures, customer complaints, internal reports, and industry trends to identify areas where things aren’t working optimally.
- Conduct Interviews: Talk to key personnel across different departments to understand their experiences with the current processes and challenges they face.
- Observe Workflows: Shadow employees and observe their daily tasks to identify bottlenecks, inefficiencies, or areas where technology or process changes can make a difference.
By combining these methods, you’ll gain a deep understanding of the root cause of the business problem and its impact on different aspects of the organization.
Identifying Key Challenges and Objectives of ML Metrics
Once you understand the business problem, it’s time to define the specific challenges that need to be addressed and the desired outcomes. Here’s what to focus on:
- Challenges: These are the specific roadblocks preventing the business from achieving its goals. For example, if the problem is low customer satisfaction, challenges might include slow order processing, lack of product information on the website, or inefficient customer service.
- Objectives: These are the measurable goals you want to achieve by solving the challenges. For the customer satisfaction example, objectives could be reducing order processing time by 20%, increasing website product information by 50%, and improving customer service satisfaction ratings by 10%.
Clearly defined challenges and objectives become the roadmap for the project, ensuring everyone is working towards the same goals.
Stakeholder Analysis and Requirements Gathering Priorities
Stakeholders are individuals or groups who are impacted by the project. A successful project requires understanding their needs and priorities. Here’s how to approach this:
- Identify Stakeholders: This includes everyone from executives and managers to end-users and even external partners who might be affected by the project.
- Prioritize Stakeholders: Not all stakeholders have the same level of influence or interest in the project. Define their level of power and influence to determine how their needs should be weighed.
- Requirements Gathering: Use various techniques like interviews, surveys, workshops, and user observation. Gather information about their needs, expectations, pain points, and how the project can address them.
By effectively monitoring machine learning metrics, you can ensure that the final solution aligns with stakeholder needs and garners their support, thereby enhancing the project’s likelihood of success.
Defining Clear The ML Metrics For Success
In the realm of machine learning (ML), success isn’t a one-size-fits-all concept. Just like any project, we need to define clear metrics for success before we even begin building our model. These metrics will be the yardstick by which we measure the effectiveness of our ML solution and its impact on the business problem it’s designed to address.

Here are some key points to consider when defining success metrics for your ML project:
- Align with Business Goals: The chosen metrics should directly tie back to the overall business objectives you’re trying to achieve. Is it increasing sales, improving customer satisfaction, or streamlining operations?
- Quantifiable Measures: The metrics should be quantifiable to allow for objective measurement and comparison. This could be percentages, dollar amounts, or other numerical values.
- Actionable Insights: The chosen metrics should provide actionable insights. They should tell you not only how well the model is performing but also how to improve it further.
Types of Best Evaluation Metrics in Machine Learning
The specific metrics used to evaluate an ML model depend on the type of problem it’s designed to solve. Here’s a breakdown of common ML tasks and their associated metrics:
- Classification: These models predict discrete categories (e.g., spam or not spam). Common metrics include Accuracy, Precision, Recall, F1-Score, and Area Under the ROC Curve (AUC-ROC).
- Regression: These models predict continuous values (e.g., housing prices). Common metrics include Mean Squared Error (MSE), Root Mean Squared Error (RMSE), and R-squared (R²).
- Clustering: These models group similar data points. Common metrics include the Silhouette Score and the Calinski-Harabasz Index.
Choosing Appropriate Metrics For The Business Problem
Choosing appropriate machine learning metrics is vital for project success. Here are key considerations when selecting metrics:
- Task type: As mentioned earlier, the type of ML task (classification, regression, clustering) dictates the most relevant metrics.
- Cost of Errors: Not all errors are created equal. Consider the relative cost of false positives (e.g., recommending a bad product) vs. false negatives (e.g., missing a fraudulent transaction).
- Data Imbalance: If your data is imbalanced (e.g., mostly negative examples), using accuracy alone might be misleading. Consider metrics like F1-Score that handle imbalance better.
- Interpretability: If understanding how the model arrives at its predictions is important, choose metrics that provide insights into the model’s behavior.
Considerations for Powerful Evaluation ML Metrics Selection
When choosing machine learning metrics for your project, it’s crucial to go beyond core measures. Consider these additional factors:
- Explainability: Can you explain the chosen metrics to stakeholders who might not have a technical background?
- Fairness: Do the chosen metrics introduce any bias or unfairness towards certain subgroups in the data?
- Computational Cost: Some metrics can be computationally expensive to calculate, especially on large datasets.
By carefully defining success metrics, understanding different types of metrics, and considering these additional factors, you can ensure a robust evaluation process for your ML project and ultimately achieve success in meeting your business goals.
Classification of Valuable ML Metrics with Brief Explanation
Machine learning metrics serve as the report cards for models, offering insights into their performance. These quantitative measures gauge a model’s efficacy on a given task, aiding in identifying shortcomings, comparing alternatives, and ultimately assessing their suitability for real-world application.
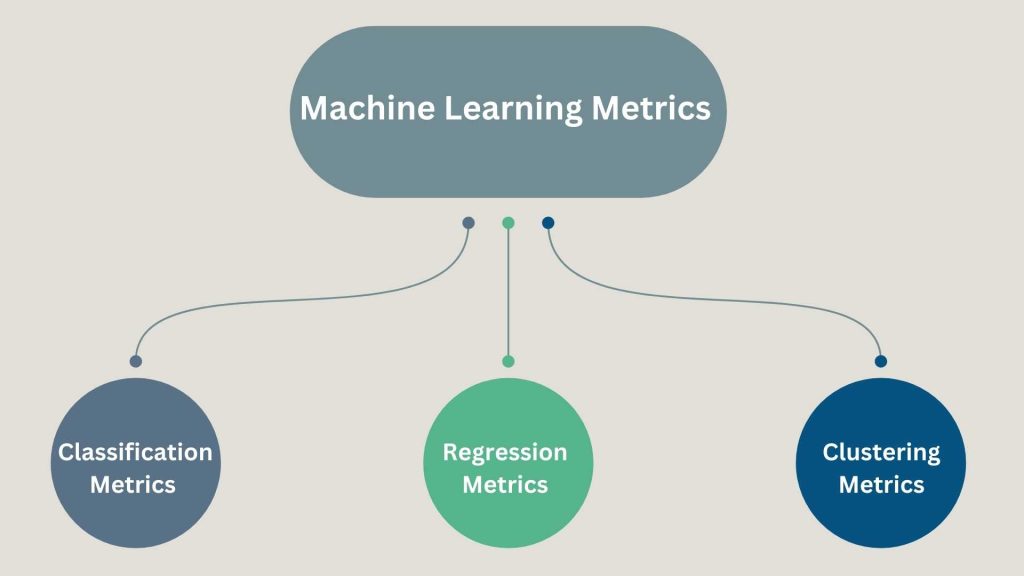
There are several categories of metrics, each suited to different types of machine learning problems:
- Classification Metrics (for predicting discrete categories)
- Regression Metrics (for predicting continuous values)
- Clustering Metrics (for grouping similar data points)

Classification Metrics
Classification tasks involve predicting which category a new data point belongs to. For example, classifying emails as spam or not spam, or predicting whether a customer will churn (cancel their service). Here are some common classification metrics:
- Accuracy: The overall percentage of correct predictions.
- Precision: Measures how many of the predicted positives were positive.
- Recall: Measures how many of the actual positives were identified by the model.
- F1-Score: A harmonic mean of precision and recall, balancing both metrics.
- Confusion Matrix: A table that visually shows how many predictions fell into each category (true positives, false positives, etc.)
- ROC AUC (Area Under the ROC Curve): Measures the model’s ability to distinguish between positive and negative classes.
Regression Metrics
Regression tasks involve predicting continuous values. Examples include predicting house prices, stock prices, or customer lifetime value. Here are some common regression metrics:
- Mean Squared Error (MSE): The average squared difference between predicted and actual values. Lower MSE indicates a better fit.
- Root Mean Squared Error (RMSE): The square root of MSE, making the errors easier to interpret in the original units.
- Mean Absolute Error (MAE): The average absolute difference between predicted and actual values. Less sensitive to outliers than MSE.
- R-squared (R²): Represents the proportion of variance in the dependent variable explained by the independent variables. Higher R² indicates a better fit, but can be misleading in some cases.
Clustering Metrics
Clustering tasks involve grouping similar data points. There’s no “ground truth” in clustering, so evaluation relies on measuring how well the groupings capture the underlying structure of the data. Here are some common clustering metrics:
- Silhouette Coefficient: Measures how well data points are assigned to the right cluster compared to how similar they are to points in neighboring clusters.
- Calinski-Harabasz Index: Compares the average distance between clusters to the variance within clusters. A higher index indicates better separation.
- Davies-Bouldin Index: Similar to Calinski-Harabasz, but uses the diameter (maximum distance) of each cluster.
Evaluation of Model Performance Using ML Metrics
Choosing the right metric depends on the specific problem and its goals. For instance, in fraud detection, where a false positive (mistakenly labeling a good transaction as fraud) might be costly, precision might be more important than accuracy.
Metrics should be used alongside other techniques for model evaluation, like visualization and error analysis. A good model will not only perform well on the metrics you choose but will also generalize well to unseen data.
Case Studies & Examples of Insight ML Metrics
In the realm of machine learning (ML), models permeate our daily lives, aiding in online product recommendations and email spam filtering. Yet, ensuring their efficacy poses a question. Explore these case studies exemplifying the application of machine learning metrics in practical contexts:
- Fraud Detection: A bank uses an ML model to identify fraudulent transactions. The model is evaluated using metrics like precision (identifying true fraud) and recall (not missing fraudulent transactions). By analyzing these metrics, the bank can fine-tune the model to minimize false positives (declining legitimate transactions) and false negatives (missing fraudulent ones).
- Recommendation Systems: An e-commerce platform uses an ML model to recommend products to users. The model’s performance is measured using metrics like click-through rate (CTR) and conversion rate (purchase completion). By optimizing these metrics, the platform can personalize recommendations, leading to increased sales and user satisfaction.
- Medical Diagnosis: A healthcare provider implements an ML model to assist with disease diagnosis. The model’s accuracy is crucial, so metrics like AUC-ROC (Area Under the Receiver Operating Characteristic Curve) are used. Analyzing the AUC helps assess the model’s ability to distinguish between healthy and diseased patients.
These are just a few examples, and the choice of metrics depends on the specific application and desired outcome.
Application of ML Metrics in Real-world Scenarios
Here’s a deeper dive into how ML metrics are applied in various scenarios:
- Regression Tasks: In weather forecasting, an ML model predicts future temperatures. Here, metrics like Mean Squared Error (MSE) or Root Mean Squared Error (RMSE) measure the difference between predicted and actual temperatures. A lower MSE or RMSE indicates better model performance.
- Classification Tasks: A social media platform uses an ML model to classify content as spam or not spam. Metrics like precision, recall, and F1-score are used to evaluate the model’s ability to identify spam accurately.
- Ranking Tasks: A search engine uses an ML model to rank webpages based on their relevance to a user’s query. Metrics like Mean Average Precision (mAP) measure how well the model ranks relevant web pages higher than irrelevant ones.
By applying these metrics, ML engineers can continuously improve the performance and effectiveness of their models in real-world applications.
Lessons Learned and Best Practices Of The ML Metrics
Here are some key takeaways and best practices for using ML metrics effectively:
- Choose the Right Metric: Don’t rely on a single metric. Select metrics that align with your specific goals. For example, accuracy might be misleading if your dataset has imbalanced classes.
- Understand the Limitations: Metrics can be deceptive. A high accuracy might not be meaningful if the model performs poorly on specific classes.
- Use Cross-Validation: Evaluate your model on unseen data using techniques like cross-validation. This helps ensure the model generalizes well on new data.
- Track Metrics Over Time: Monitor your model’s performance over time. A sudden drop in metrics might indicate data drift or concept shift, requiring model retraining.
- Visualize Performance: Use visualizations like confusion matrices or ROC curves to gain deeper insights into model performance and identify areas for improvement.
By following these best practices, you can leverage ML metrics to build robust and effective models that deliver real-world value.
Conclusion:
In conclusion, we’ve emphasized the importance of continuously monitoring and adapting our chosen metrics. By regularly reviewing their performance, we can ensure they accurately reflect our goals. This adaptability allows us to identify areas for improvement and optimize our strategies for long-term success. Remember, static metrics in a dynamic world can lead to missed opportunities and hinder progress.
Frequently Asked Questions
1) Why do we use metrics in machine learning?
Users employ metrics to monitor and measure a model’s performance during both training and testing phases, with no requirement for them to be differentiable. However, if a performance metric is differentiable for certain tasks, it can also serve as a loss function, possibly with added regularizations, like MSE.
2) Which machine learning metrics to use?
Different machine-learning tasks require specific evaluation metrics. Regression tasks commonly use metrics such as Mean Squared Error (MSE), Root Mean Squared Error (RMSE), and R² (R-squared). In contrast, classification tasks use metrics like Accuracy, Confusion Matrix, Precision and Recall, F1-score, and AU-ROC.
3) Which two metrics can you use to evaluate a classification machine learning model?
Classification Metrics like accuracy, precision, and recall are good ways to evaluate classification models for balanced datasets, but if the data is imbalanced then other methods like ROC/AUC perform better in evaluating the model performance.
4) Which evaluation metric is commonly used for classification problems?
Logarithmic loss, also known as log loss or cross-entropy loss, is a useful evaluation metric for classification problems where probabilistic estimates are important. The log loss measures the difference between the predicted probabilities of the classes and the actual class labels.
5) What is the accuracy metric in machine learning?
You can measure the accuracy on a scale of 0 to 1 or as a percentage. The higher the accuracy, the better. You can achieve a perfect accuracy of 1.0 when every prediction the model makes is correct. This metric is simple to calculate and understand.
6) What are KPIs in machine learning?
Metric learning in ML involves learning a distance function to measure the similarity or dissimilarity between pairs of data points, crucial for tasks like classification and clustering.
7) What is metric learning in ML?
Metric learning in machine learning (ML) involves learning a distance function or metric from data to measure similarity or dissimilarity between pairs of samples. It aims to optimize this metric to improve the performance of tasks like classification, clustering, or retrieval.